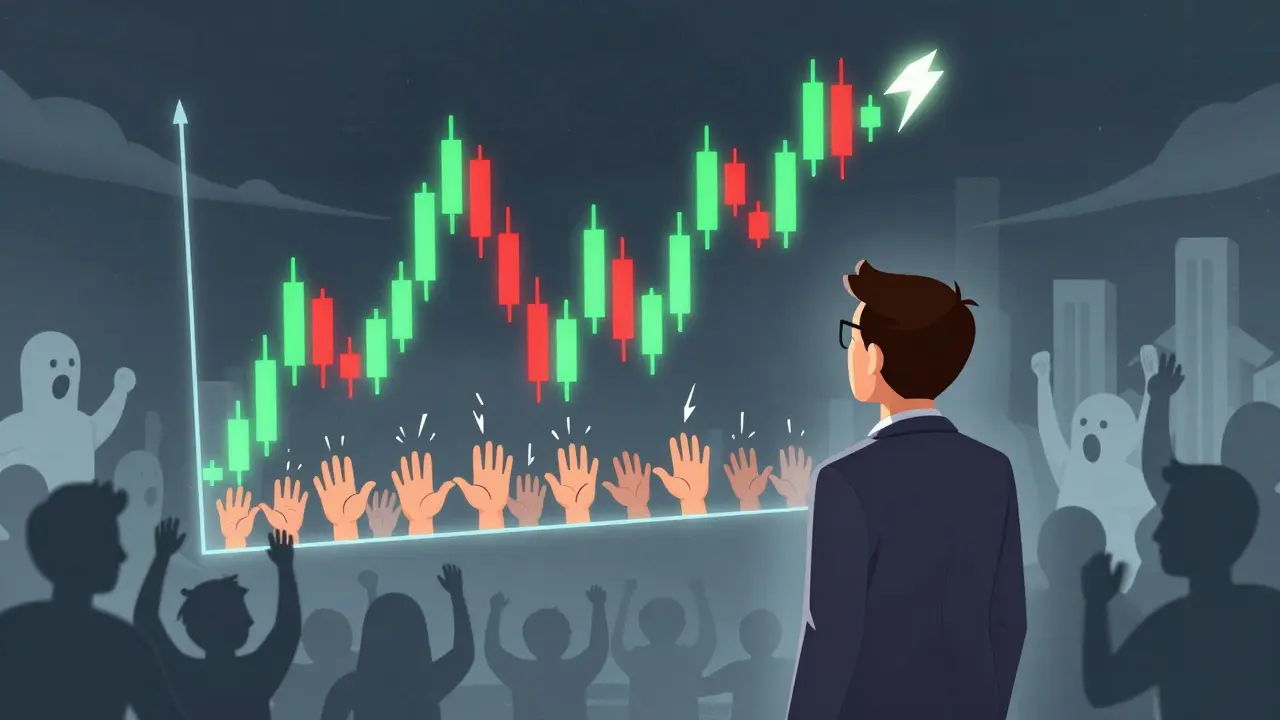
How to Read Spot Price Charts for Cryptocurrency and Financial Markets
Learn how to read spot price charts to identify trends, patterns, and trading signals in cryptocurrency and financial markets using candlesticks, volume, and multi-timeframe analysis.