


Crypto Project Fundamental Score Calculator
Project Comparison Calculator
Evaluate crypto projects using the fundamental comparison framework from the article. Input scores for each pillar, select your sector, and calculate the health index.
Comparison Example
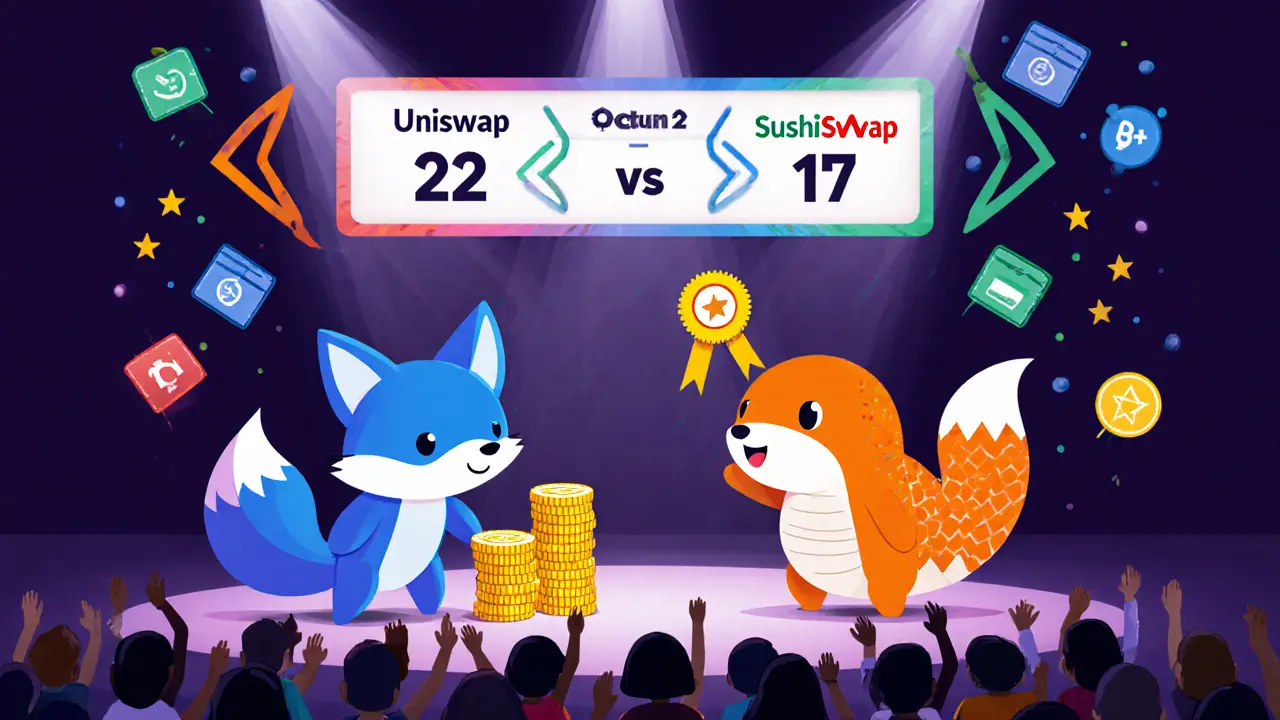
See how Uniswap and SushiSwap compared using this methodology.
SushiSwap: 17/25 health index
Based on: Technology (5), Tokenomics (4), Team (4), Market Position (5), Risk (4)
Fundamental Health Index
When assessing digital assets, Crypto Project is a blockchain‑based initiative that offers a token, protocol, or service, aiming to solve a specific problem in the crypto ecosystem. Investors and developers rely on systematic crypto project comparison to separate hype from sustainable value.
Key Takeaways
- Fundamental comparison blends traditional finance ratios with blockchain‑specific data.
- A solid framework covers technology, tokenomics, team, market position and risk factors.
- Sector‑specific checklists (DeFi, NFT, infrastructure) avoid one‑size‑fits‑all mistakes.
- Public tools like CoinGecko, Glassnode, and on‑chain explorers provide most of the data you need.
- Scoring models let you rank projects quickly and update the list as new information appears.
Why a Fundamental Lens Beats Pure Price Watching
Price charts are noisy; they react to sentiment, macro news, and short‑term speculation. A Token the native unit that fuels a crypto project’s economics that looks good today can crumble if the underlying protocol can’t scale or the team loses credibility. By focusing on intrinsic attributes-code quality, user adoption, funding depth-you create a more reliable compass for long‑term decisions.
Building a Multi‑Dimensional Comparison Framework
The most effective models treat a crypto project as a collection of inter‑related components. Below is a quick checklist that covers the five pillars most analysts use:
- Technology Stack - consensus type, layer‑1 vs layer‑2, smart‑contract language.
- Tokenomics - supply caps, inflation schedule, utility vs governance.
- Team & Governance - developer background, advisory board, on‑chain voting mechanisms.
- Market Position - user base, total value locked (TVL), liquidity depth.
- Risk Profile - regulatory exposure, code audit status, decentralization level.
Each pillar can be scored on a 0‑5 scale, then weighted according to your investment horizon. The total score becomes the “fundamental health index” you can compare across dozens of projects.
Core Metrics Explained
Below are the metrics you’ll actually pull from data providers, with a brief note on why they matter.
- Market Capitalization total dollar value of all circulating tokens - signals overall market confidence but can be inflated by low liquidity.
- Total Value Locked (TVL) the amount of assets secured in a protocol’s smart contracts - key for DeFi platforms, reflects real economic activity.
- Daily Active Users (DAU) unique wallet addresses interacting with the protocol each day - a proxy for network effect.
- Funding Raised venture or grant capital invested in the project - shows runway and external validation.
- Code Audits security reviews performed by reputable firms - lowers exploit risk.
- On‑Chain Analytics data derived from blockchain explorers, e.g., transaction counts, gas fees - provides granular insight into usage trends.
Sector‑Specific Checklists
Not all pillars weigh the same in every niche. Here’s how you can fine‑tune the framework for three common sectors.
DeFi Platforms (e.g., DEXes, Lending)
- Liquidity depth and slippage metrics.
- Smart‑contract audit count and severity.
- Yield sustainability - compare APR vs underlying asset risk.
- Governance token distribution - decentralization score.
NFT Marketplaces & Scaling Solutions
- Transaction cost (gas) per mint/sale.
- Support for cross‑chain NFTs.
- Partnerships with major artists or brands.
- Layer‑2 adoption rate - look at roll‑up usage.
Infrastructure & IoT Networks
- Node count and geographic distribution.
- Data throughput and latency benchmarks.
- Real‑world use‑case revenue (e.g., Helium hotspot earnings).
- Regulatory compliance - spectrum licenses, data privacy.
How to Gather Reliable Data
Public platforms have made data collection almost painless. Below is a quick guide:
- CoinGecko / CoinMarketCap - market cap, circulating supply, price charts.
- Glassnode - on‑chain metrics like active addresses, realized cap.
- Dune Analytics - custom SQL queries for any on‑chain data point.
- Company filings & Fundraising decks - funding rounds, investor lists.
- GitHub / GitLab - commit frequency, contributor count, open‑source health.
- Social sentiment tools - Reddit, Twitter volume, community engagement scores.
Cross‑checking at least three sources for any metric reduces the chance of a data‑quality error.
Live Example: Uniswap vs SushiSwap
Both are automated market makers (AMMs) in the DeFi sector, but their fundamentals differ.
| Project | Daily Active Users | Funding Raised | Moat | Sector |
|---|---|---|---|---|
| Uniswap | 5M | $200M | First‑mover liquidity depth | DeFi DEX |
| SushiSwap | 2.5M | $150M | Community incentives, token‑based rewards | DeFi DEX |
Scoring each pillar (technology = 5 for both, tokenomics = 4 for Uniswap, 3 for SushiSwap, team = 4 vs 3, market position = 5 vs 3) yields a total index of 22 for Uniswap and 17 for SushiSwap. The numbers illustrate how a systematic approach surfaces the strength of Uniswap’s liquidity moat.
Common Pitfalls & Risk Adjustments
Even a solid framework can be tripped up by hidden risks.
- Regulatory shocks - a sudden ban in a major jurisdiction can wipe out TVL instantly. Always add a “regulation” weight to the risk score.
- Code clone danger - many projects copy open‑source contracts. Check commit history and unique innovation points to avoid “me too” traps.
- Funding decay - large rounds don’t guarantee long‑term runway. Look at burn rate and cash‑on‑hand metrics.
- Community decay - a shrinking Discord or Telegram indicates waning interest. Track monthly active members.
Putting It All Together - A Simple Scoring Model
Here’s a ready‑to‑use spreadsheet layout you can copy:
- List each project in rows.
- Create columns for the 12 metrics described above.
- Assign a score 0‑5 for each metric.
- Apply sector‑specific weights (e.g., Liquidity 30% for DEXes).
- Sum the weighted scores - the highest total signals the strongest fundamentals.
Update the scores quarterly. The model is lightweight enough for retail investors but robust enough for fund managers.
Next Steps for Practitioners
Now that you have a blueprint, consider these actions:
- Pick three projects you’re already watching and run the scoring model.
- Set up a Google Sheet that pulls live market cap from CoinGecko API.
- Schedule a monthly “fundamental review” where you re‑run the audit and note any metric shifts.
- If you manage a launchpad, use the model as a gate‑keeping checklist before accepting new token sales.
Following a repeatable process will keep emotion out of the equation and let data drive your crypto decisions.
Frequently Asked Questions
How often should I re‑evaluate a crypto project's fundamentals?
A quarterly refresh works for most retail investors. If you’re a fund manager or launchpad operator, a monthly review is safer because funding rounds, audits, or regulatory updates can happen quickly.
Can I rely solely on on‑chain metrics for comparison?
On‑chain data is powerful but blind to off‑chain factors like legal risk, partnership announcements, or team changes. Blend on‑chain with off‑chain signals for a complete picture.
What weight should I give to community sentiment?
Community health usually accounts for 10‑15% of the total score. Track Discord member growth, tweet volume, and sentiment scores to quantify it.
Is a high market cap always a good sign?
Not necessarily. A large cap can hide low liquidity or an over‑inflated supply. Pair market cap with liquidity depth, TVL, and user metrics to gauge real strength.
How do I handle projects that span multiple sectors?
Create a hybrid checklist that merges relevant pillars from each sector. For example, a DeFi‑enabled NFT platform should be evaluated for both liquidity depth and NFT mint costs.


People Comments
Great breakdown of the scoring methodology! The weighting system makes sense, especially the sector‑specific tweaks for DeFi and NFT projects. I especially like the way the risk profile is capped at 0.2 so it doesn’t dominate the overall health index. For newcomers, just remember to keep each pillar within the 0‑5 range to avoid the “Invalid inputs” warning. 👍
This calculator is just a gimmick.
Sure, the framework looks polished, but it ignores real‑world adoption metrics that matter most. The token‑omics weight is arbitrary, and anyone can game the scores by inflating the tech rating. Plus, the risk profile seems shoe‑horned into a generic bucket, which makes the whole thing feel pretentious. I’d rather see on‑chain activity data integrated.
From a cultural standpoint, the inclusion of sector‑specific weights acknowledges the diverse ecosystems we see across blockchain. The tech stack evaluation aligns with industry standards like scalability, consensus finality, and interoperability. Tokenomics, when dissected using economic theory, reveals supply‑demand dynamics that drive sustainable growth. Governance metrics, especially decentralization indices, are crucial for long‑term resilience. Market position, measured by TVL and active users, rounds out a holistic view.
As an American, I’m proud to see US‑based projects getting the recognition they deserve! 🇺🇸 The calculator should prioritize native blockchain initiatives over foreign ones. The current neutral stance feels like a betrayal to our home‑grown talent. 🌟🚀
Honestly, the whole “risk profile” section is just a buzzword parade. You could slap any number there and the UI will still look sleek. Also, why does the market position only count TVL? That’s a narrow view, and it shows the developers haven’t done their homework.
The fundamental health index, as presented, operates on a veneer of quantitative rigor that belies its underlying subjectivity. First, the allocation of equal weights in the generic sector assumes a one‑size‑fits‑all paradigm, which is philosophically untenable in a space as heterogeneous as crypto. Second, the reliance on user‑entered scores introduces a bias floor that can be gamed by optimistic self‑assessment, effectively turning the tool into a self‑congratulatory scoreboard. Third, the risk profile weight, while modest, does not account for systemic risks such as regulatory clampdowns that can render even the most technically sound projects inert. Fourth, the omission of on‑chain telemetry-like active address count, transaction throughput, and gas efficiency-means the index is blind to actual network vitality. Fifth, the tokenomics evaluation appears to focus solely on supply mechanics, ignoring demand‑side catalysts such as utility and network effects. Sixth, governance scoring seems to be based on arbitrary criteria rather than measurable decentralization metrics, which undermines its credibility. Seventh, market position is reduced to a single dimension, neglecting competitive landscape analyses that could provide richer context. Eighth, the UI, while aesthetically pleasing, masks the methodological opacity with slick visual cues, potentially misleading users about the robustness of the underlying calculations. Ninth, the lack of transparency about data sources raises questions about the provenance of input values. Tenth, there is no provision for dynamic weighting that adjusts to evolving market conditions, which is essential for a living metric system. Eleventh, the tool does not incorporate community sentiment, a factor increasingly recognized as a leading indicator of project momentum. Twelfth, the scoring granularity of 0‑5 per pillar, though user-friendly, sacrifices nuance that could be captured with a finer scale. Thirteenth, the health level descriptors ("Excellent", "Good", etc.) are overly simplistic, failing to convey the complex risk‑reward trade‑offs inherent in crypto investments. Fourteenth, the absence of a sensitivity analysis leaves users blind to how small input variations might swing the final score dramatically. Finally, while the calculator is a commendable attempt at democratizing project evaluation, it must evolve beyond its current static framework to truly serve as a credible decision‑support tool.
I love the clarity you brought, but watch out for the “Invalid inputs” alert – it can be a bit finicky if you type a decimal like 4.5 instead of a whole number. Also, remember to hit “Calculate” after each field change; otherwise the old score sticks around.
Hey folks, just wanted to say this tool could be a game‑changer for newcomers trying to cut through the hype. If you plug in honest numbers, you’ll get a quick health snapshot that’s super helpful when comparing a DeFi protocol to an NFT marketplace. Keep experimenting with the sector weights to see how your project's profile shifts!
Nice work, everyone. The simple layout makes it easy to understand, and the color‑coded results give an instant visual cue. Definitely a solid addition to any crypto analyst’s toolkit.
Totally agree with the emphasis on governance and interoperability – those are the real differentiators now.
Wow, look at that color change – feels like a hype train to the moon!
Glad you found it useful! Just a heads‑up: the sector dropdown defaults to “General,” so if you’re evaluating a pure infrastructure project, switch it to get more accurate weights.
Did you know the matrix is actually a simulation?
Interesting nationalist angle, but the tool itself stays neutral – it doesn’t embed any geopolitical bias in the calculations.
It works, but the UI feels a bit over‑engineered for what it does.
Love the vibe! This calculator is 🔥 – especially the risk profile section, it really helps spot red flags early. 🚀🚀
Thinking about this, the health index reminds me of a philosophical balance between potential and peril – a modern twist on the age‑old quest for equilibrium.
Honestly, the whole thing seems like a gimmick to me; I could just eyeball the numbers myself.
Great job on making the calculator user‑friendly. If anyone’s stuck on input validation, just double‑check that each field is between 0 and 5.
The weighting feels arbitrary why even trust a score that can be skewed by a single pillar